Green and the city: a first exploration into measuring early modern Amsterdam’s green spaces.
/In this blog post, Research Master student Charlotte Meijer shares the preliminary results of her research project exploring green spaces of Amsterdam through the investigation of historical maps before, during, and after the seventeenth-century expansions.
Today, urban growth is often seen as a threat to nature. Recent surveys of Amsterdam show that since 2003 urban green spaces have decreased with a staggering 11% as a result of the densification of the inner city. This decrease is furthermore accompanied by a population increase of 7%.[1] But what was this dynamic like in early modern Amsterdam? After all, over the course of the seventeenth century the city grew explosively as a result of several expansions. Did the city’s explosive growth result in a loss of urban green spaces? Where did green spaces (dis)appear? And was there – as there is today – a correlation between income and access to these green spaces?[2] In recent years new technologies have enabled historians to look at maps in surprising new ways and use them to reconstruct everyday life in Amsterdam. However, the flora and fauna in this historical city that appears both so familiar and yet so strange to us remain unexposed. Even J.E. Abrahamse’s extensive study De Grote Uitleg van Amsterdam (2010) on the third and fourth expansion of Amsterdam – which respectively took place in the first and second half of the seventeenth century – only occasionally mentions green spaces such as gardens and parks. For this short research project, I analyzed several maps from before, during, and after the seventeenth-century enlargements, using polygons in QGIS to measure, visualize, and calculate (relative) changes in Amsterdam’s urban green spaces.
The first and perhaps most important step in this project was finding the ‘right’ maps. There is, of course, no shortage of historical maps of Amsterdam, but not every map was detailed or accurate enough. For the period before the seventeenth century, I used a second-edition map by Pieter Bast (1597), which shows great attention to both detail and accuracy and is considered to be one of the oldest detailed maps of Amsterdam. To measure changes after the third expansion a map by Balthasar Florisz. Van Berckenrode was used, again a second edition (1647). Changes during the fourth expansion were harder to measure, due to a lack of maps showing accurate gardens and trees. Here various maps and estimates were used to calculate the increase in urban green spaces, something I’ll come back to later.
The second step was to distinguish four categories of urban green spaces according to which the polygons would be drawn. The first category is ‘gardens’, by which I mean every fenced-in space behind or surrounding a building with a garden pattern drawn inside of it. The second category consists of what I call ‘green-promenades’, rows of trees lining the streets and canals. Since it is very hard to calculate the surface area of a single tree and polygonising individual trees would be too time consuming, I opted for drawing rectangular polygons around rows of trees, including some parts of the streets where one could stand or sit beneath these green giants (fig 1). ‘Other’ spaces – including graveyards, bleachfields, and potential gardens in neighborhoods that were still being developed – make up the third category. Amsterdam as it had been drawn within the city walls was the fourth category and functioned as a point of reference to calculate relative changes. The third step was hand-drawing all the polygons and calculating their (relative) size. While QGIS offers automized methods to draw polygons, these were found to be ineffective because they rely on color, something all maps used here lack since they are printed in black and white.

Fig 1. Trees in Amsterdam lining the canals. P. Schenk, Herengracht, 1700-1725. Collectie Stadsarchief Amsterdam, nr. 010097003451
Results of the first, second and third expansions
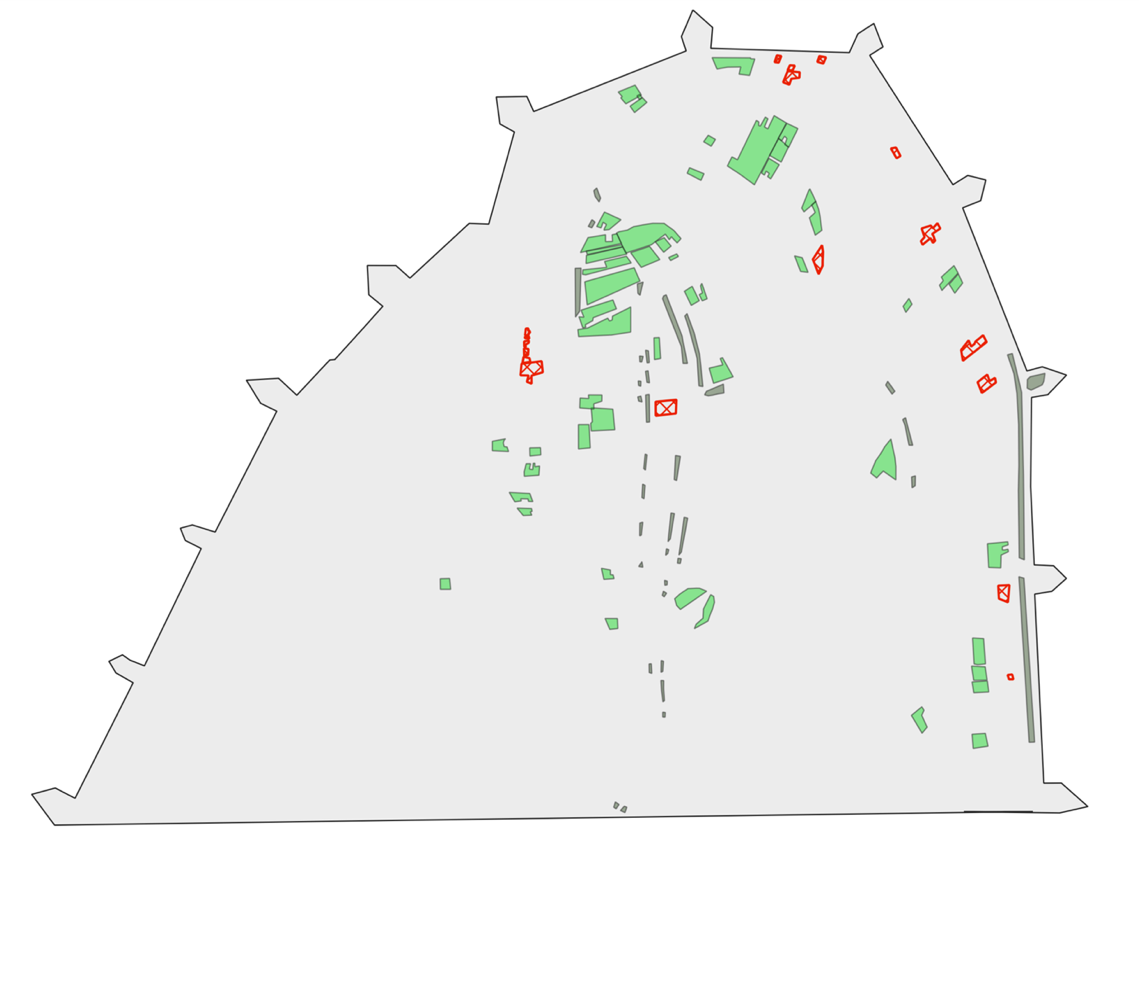
Fig 2. Polygonised version of the Bast map (1597). Bright green spaces are ‘Gardens’, dark green lines are ‘Green Promenades’ and red spaces are ‘Other’.
The Bast map from before the third- and fourth expansion contains relatively few green areas (fig. 2). Most ‘gardens’ – depicted as bright green spaces on the map below – are in fact orchards surrounding institutions such as the Vrouwen gasthuys (women’s hospital) in the left upper corner. This can be explained by the fact that up until twenty years before this map was made, these institutions had been Catholic convents that were often surrounded by orchards.[3] Unlike the other maps used here, Bast’s map also does not clearly distinguish cemeteries, instead showing unidentified green spaces with trees inside surrounding the church. It is, however, highly likely that these were (formerly) used as such, since we know from the archives that a new graveyard was opened behind the New Church in 1578.[4] As to why there are so few private gardens depicted, we can only guess. One possible reason is that Bast could only draw what he saw from the outside. Hidden gardens in dense building blocks were therefore as invisible to him as they are to us. Another possible reason is that there simply were not that many gardens inside of the compact city center and that we have to look outside of the city walls to find our ‘urban’ gardens. This is supported by the large quantity of gardens drawn outside of the gates on the right side of the map (fig. 3). Another notable difference between Bast’s map and subsequent ones is the low number of trees outside gardens which can be explained by the fact that the official city forester – whose job it was to plant and look after trees – was appointed only 3 years after this map was made.

Fig 3. Gardens outside of the fortifications on the Bast map.
The map by Van Berckenrode showing the third expansion does not just cover a bigger area, but also shows relatively more green spaces (fig 4). The first major difference is the increase in private gardens behind houses, especially in the newly added canal belt and the Jordaan area. Looking at the previously mentioned former public institutions, this map also shows the transition from urban orchards to more orderly gardens by changing patterns inside these secluded areas. Furthermore, some orchards were transformed into bleachfields, or a combination of bleachfield-courtyard. This could be explained by that fact that more time had passed since the city had expropriated these former convents than on Bast’s map, giving the council more time to repurpose these buildings and their surroundings.

Fig 4. Polygonised version of the Van Berckenrode map. Bright green spaces are ‘Gardens’, dark green lines are ‘Green Promenades’ and red spaces are ‘Other’.
A second large change can be found in the rows of trees planted along the canals. Together these make up about 4.5% of Amsterdam’s surface area on this map, no small feat. As shown on the polygonised aerial-view map below, one can see exactly where the main canals flowed – both in the older and newer parts of the city – just by looking at the green promenades. To the seventeenth-century traveler these canals must have looked like a green oasis, for Amsterdam was one of the only cities to plant trees on this scale.[5] Besides trees and gardens, I found an increase in ‘other’ areas, especially in the Jordaan. of these unknown areas can be explained by the fact that, at the time of surveying and drawing the map, the Jordaan was still being developed. It is therefore likely that many of these spaces would eventually become gardens but were left empty by Van Berckenrode. Other ‘others’ were the aforementioned bleachfields, and an increasing number of cemeteries that (as shown on fig. 5) were also green spaces in the sense that they contained grass and trees. These ‘other’ spaces were thus open spaces that could have been green but might as well have been mostly paved. In many cases I simply could not be sure.

Fig. 5. J. Stellingwerff, Ander Gezicht Van 't S. Kerkhof. Pen en Penseel, 1724. Collectie Stadsarchief Amsterdam, nr. 010097001370
This short analysis of these two maps reveals a couple of important insights. First and foremost, it hints to the opposite of today’s city-nature dynamic. Amsterdam grew explosively in the seventeenth century, but the relative surface area of green spaces grew even harder. This was mostly thanks to the increase in private gardens, which brings me to the second question I posed at the beginning of this blogpost: the correlation between income and access to green spaces. Here we encounter a situation much like our current circumstances. The biggest gardens emerged behind the houses along the main canals, both in the famous canal belt and the Jordaan. As research by Clé Lesger and Marco van Leeuwen has shown, these parcels were owned by the more affluent members of society.[6] Much like today, a higher income thus meant easier and better access to green spaces.
The fourth expansion and further research
As discussed above, the changes of the fourth enlargement were harder to measure because maps became less detailed, meaning they showed individual houses and gardens less accurately and focused more on the geometric shapes of the city. This final part of the project should therefore be regarded as a first exploration. The basis was provided by a map by Gerrit de Broen from 1724. Something that instantly catches the eye is the lack of trees. Since there are no records mentioning trees being cut down on a city-wide scale, this most likely did not reflect the real situation but an artistic choice. Another problem was that gardens suddenly all had the same size and annexes disappeared, something that again did not reflect reality at the time. To look at changes in the Jordaan I used a map by Frederick de Wit (1688) which shows how the new, orderly blocks of this neighborhood featured the same kind of garden as could be found behind the luxurious houses of the canal belt, just on a smaller scale. Together with a detailed map of the Plantage drawn by Johannes Schilling (1774) these sources show how the relative surface area of green spaces was still increasing, be it at a slower pace (fig. 6).

Fig 6. Notice how the gardens in the Plantage on the left (Schilling) show varying sizes and annexes, while the gardens on the right (Broen) are all roughly the same size and don’t contain any buildings.
All this leads to many more questions which go beyond the remit for this exploratory research project and provide interesting starting points for further research. Some examples include examining the difference between open and closed spaces, tracking changes per zone, researching the accessibility of green spaces, looking at the function and quality of urban green spaces, and finding out to what extend these green spaces were really green (meaning they contained plants and trees). Whether something was meant to be enjoyed as an urban green space or just happened to be green by accident is also worth looking into. The city’s fortifications, not included in this project for pragmatic reasons, are another interesting category that deserves more attention. Finally, further research might shed critical light on the maps used in this preliminary study. To what extent do their distortions influence these findings? Are there other, perhaps more reliable ways, to calculate the changes in the sizes of green spaces? Looking at these maps one thing becomes crystal clear: there is a whole world yet to be discovered.
[1]M. Giezen, S. Balikci and R. Arundel, ‘Using Remote Sensing to Analyse Net Land-Use Change from Conflicting Sustainability Policies: The Case of Amsterdam’, ISPRS International Journal of Geo Information 7:9 (2018) 381. https://doi.org/10.3390/ijgi7090381
[2] L. Nesbitt e.a., ‘Who has access to urban vegetation? A spatial analysis of distributional green equity in 10 US cities’, Landscape and Urban Planning 181 (2019) 51-79. https://doi.org/10.1016/j.landurbplan.2018.08.007
[3] H. Zantkuyl, ‘Stedelijke erven en tuinen tot omstreeks 1850’, in: H. Zantkuyl en D. Carasso eds. Erf en tuin in oud-Amsterdam. De ontwikkeling van het besloten erf en de stadstuin in de oude binnenstad (Amsterdam 1982) 9-59, see 8.
[4] Dodenakkers Funerair Erfgoed, ‘Amsterdam – Verdwenen begraafplaatsen’, https://www.dodenakkers.nl/artikelen-overzicht/algemeen/verdwenen/amsterdam-verdwenen-2.html (last accessed April 5 2021).
[5] Abrahamse, De Grote Uitleg, 289- 290.
[6] C. Lesger and M.H.D. Van Leeuwen, ‘Residential segregation from the Sixteenth to the Nineteenth Century: Evidence from the Netherlands’, The Journal of Interdisciplinary History 42:3(2012) 333-369.
I would like to thank Ivan Kisjes and Leon van Wissen from CREATE for helping me with QGIS, and Antonia Weiss and Erik de Jong for their ideas and advice.